Visualize sales and bookings, make better business decisions
The more numbers on your business performance you can get and analyze, the better actions you can take. We provide you with filterable charts and graphs that allow you to get the needed data on your rental business performance.
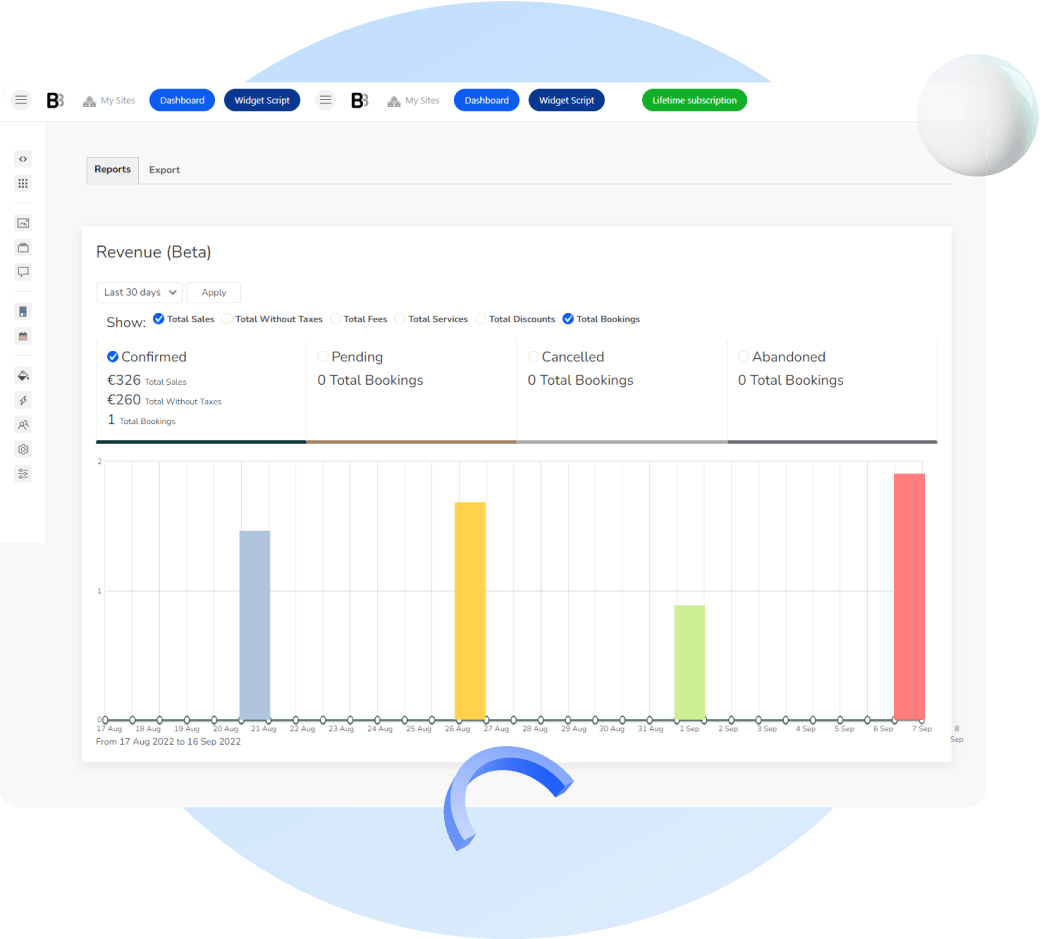
Revenue chart
Thanks to the built-in analytics reports, you can visualize various essential data, such as the number of bookings or earnings within a certain period of time, in an instantly comprehensible graphical representation.
Download data reports in easy-to-grasp formats
Take the needed data on bookings with you. BNBForms allows you to generate booking reports in a single click of a button! Those can contain various data based on the accommodation type, date, and more. For example, rate, cost, fees, and more information assigned to a particular booking.
Analyze revenue before and after taxes
The analytics tool allows you to filter data by total sales, without or without taxes and discounts taken into account. You can also analyze how much you earn from selling extra services in particular. Even more so, you can view your losses from canceled or abandoned bookings.